

Using data from the U.S. Bureau of Labor Statistics, FoxHire tracked nonfarm employment across all 50 states from 2019 through 2024. The numbers tell a story that goes beyond the pandemic. They reveal a structural shift in where employers are choosing to hire, grow, and invest. The regulatory environment plays a bigger role in that shift than most people realize.
States like Texas, Florida, Tennessee, and Georgia recovered faster than compliant-heavy states after COVID. They ended the period with significantly more jobs than they had before the pandemic hit. Meanwhile, states like California, New York, Illinois, and Massachusetts, which are consistently ranked among the most complex states for multi-state employment compliance, recovered more slowly. In several cases, they barely grew at all on a net basis.
The data raises a pointed question for state lawmakers: when you make it harder for employers to hire, do your citizens pay the price?
(Skip to the Complexity Index Chart)
The COVID Crash: All States Fell, But Not Equally
Every state experienced significant job losses in 2020. Nationally, nonfarm employment dropped by approximately 22 million jobs between February and April 2020, the steepest decline in recorded U.S. history.
The crash was not uniform. States with larger service and hospitality sectors were hit hardest. The data also shows that high-regulation states fell harder, on average, than their lower-regulation counterparts.
The average COVID-related employment drop in high-regulation states was -7.2%. In lower-regulation states, the average drop was -5.8%. That gap of roughly 1.4 percentage points may sound small, but at the scale of millions of workers, it represents hundreds of thousands of jobs lost faster and deeper than the national trend.
Notable 2020 employment declines in high-regulation states: New York (-9.9%), Massachusetts (-8.4%), New Jersey (-8.1%), Pennsylvania (-7.6%), California (-7.1%), Illinois (-7.0%).
By comparison, lower-regulation states like Idaho (-0.7%), Utah (-1.4%), Texas (-4.2%), and Tennessee (-3.8%) experienced significantly shallower drops.
The Recovery: Where Jobs Came Back and Where They Did Not
By 2021, the national recovery was underway. The pace of long-term growth diverged sharply, and the gap between high- and low-regulation states has only widened since.
Here is nonfarm employment growth from 2019 to 2024 for key lower-regulation states:
And for high-regulation states over the same period:
The contrast is striking. The 11 fastest-growing states from 2019 to 2024 are all lower-regulation states. Meanwhile, 8 of the 10 states in our high-regulation group sit at the bottom of the national rankings for job growth over the same period.
The averages reinforce this: high-regulation states averaged +2.4% growth from 2019 to 2024. Lower-regulation states averaged +3.8%. That 1.4-point gap, compounded across millions of workers and hundreds of thousands of businesses making hiring decisions every day, adds up to a measurable divergence in employment opportunity across state lines.
Companies Moved Out of Complex States
Employment data tells part of the story. Corporate relocation data tells the rest.
Between 2018 and 2024, Dallas-Fort Worth gained 100 corporate headquarters relocations, more than any other metro in the country. Austin added 81. Nashville added 35. The San Francisco Bay Area lost 156 headquarters over the same period. Los Angeles and Irvine lost another 106. New York City lost 27. These numbers represent named companies making deliberate decisions about where to operate.
From California:
- Tesla moved its headquarters to Austin in 2021, with Elon Musk citing regulatory friction as a driving factor.
- Oracle followed to Austin.
- Hewlett Packard Enterprise moved to Houston.
- Charles Schwab relocated to Westlake, Texas.
- CBRE moved to Dallas.
- Chevron completed its move to Texas, and In-N-Out Burger relocated to Tennessee in 2025, with the company's president citing the difficulty of operating a business in California.
From New York:
- Elliott Management, one of the world's largest hedge funds, relocated to West Palm Beach, Florida.
- Icahn Capital Management left for Florida.
- ARK Invest moved to St. Petersburg, Florida.
- AllianceBernstein relocated its full headquarters to Nashville in 2021, taking more than $600 billion in assets under management with it.
Bloomberg reported that New York lost nearly $1 trillion in managed assets as financial firms departed between 2020 and 2023.
From Illinois:
- Boeing left Chicago for Virginia after 20 years.
- Caterpillar moved corporate jobs to Texas after nearly a century in the state.
- Citadel relocated from Chicago to Miami.
The Illinois Policy Institute found that business relocations out of Illinois tripled after the pandemic.
The pattern is consistent across compliant-heavy states. The states that rank highest in compliance complexity in our survey, New York (87.3), California (83.9), Illinois, and New Jersey, are the same states that have lost the most corporate headquarters over the past six years. The states gaining them, Texas, Florida, Tennessee, and Georgia, rank among the lowest in compliance burden.
Businesses don't publish press releases that say "we left because compliance was too hard." But when you read the reasons they do give, including regulations, costs, difficulty operating, and the desire for flexibility, they are describing compliance burden by another name.
Introducing FoxHire's State Complexity Index
Employment data tells part of the story. Survey data tells another. We combined both into a single metric: FoxHire's State Complexity Index, a composite score for every U.S. state that measures how much friction employers actually face when hiring there.
The index draws on three inputs: The first is survey difficulty, which accounts for 50% of the score. This comes directly from FoxHire's 2026 Multi-State Hiring Compliance Burden Index, where HR, payroll, staffing, and legal professionals were asked to name the states that create the most compliance friction. We averaged each state's score across three professional groups: recruiters, benefits administrators, and legal and compliance teams. The second input is employment growth, weighted at 30%. States where nonfarm employment grew more slowly from 2019 to 2024 receive a higher score, because sluggish job growth is a measurable downstream effect of compliance burden. The third input is regulatory profile, weighted at 20%, based on whether the state is classified as high or lower regulation by survey respondents.
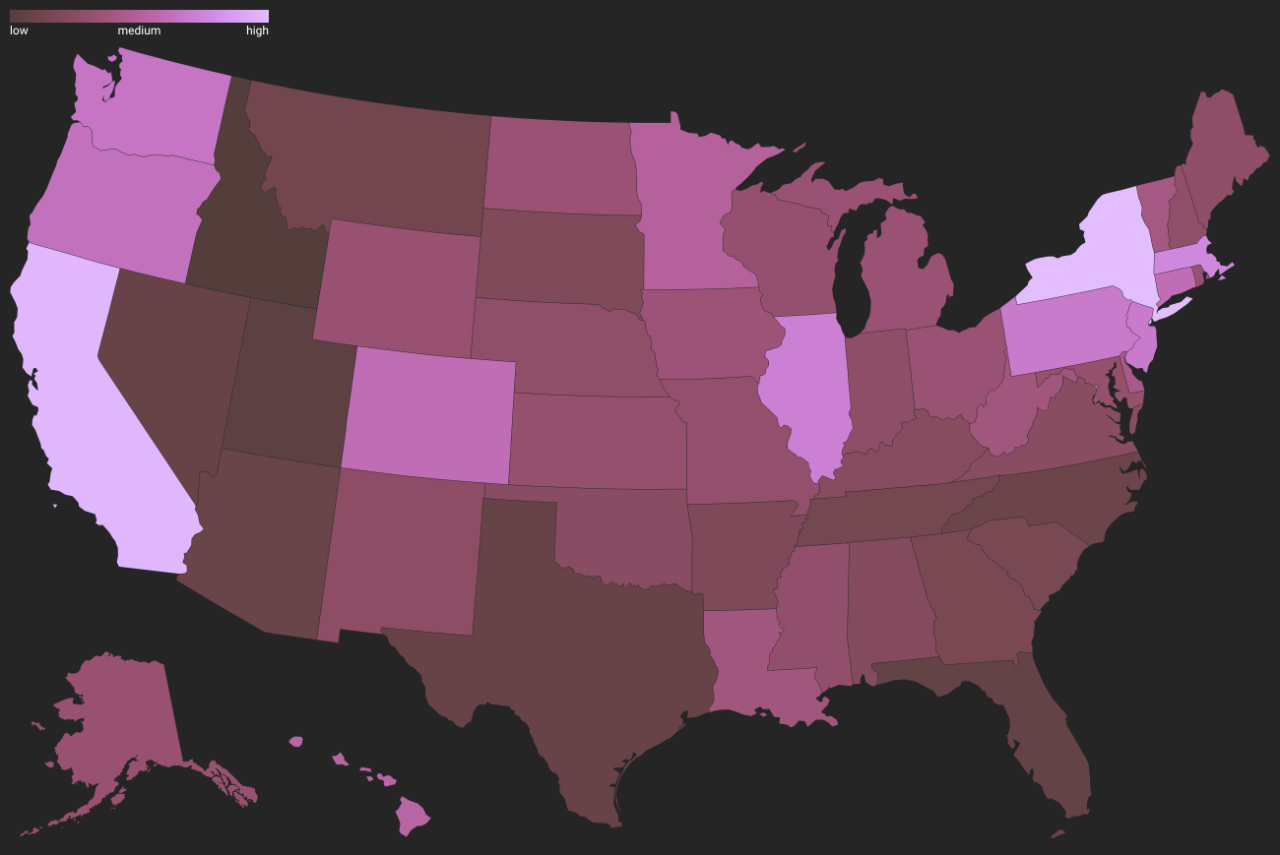
The result is a score from 0 to 100 for all 50 states, where higher means more complex.

Each state's tooltip displays six data points that make up the FoxHire State Complexity Index. Rank is the state's overall position among all 50 states, where 1 represents the most complex hiring environment in the country. Complexity Score is the weighted composite score on a scale of 0 to 100, combining all three underlying factors. Survey Score reflects how frequently respondents in the Multi-State Hiring Compliance Burden Index named that state as one of the most difficult states to hire in. Growth Inverse is a derived metric based on post-COVID employment growth; states with slower job recovery receive a higher score, because reduced growth correlates with heavier compliance friction. Regulatory Profile is a categorical rating (Higher, Moderate, or Lower) based on the number and complexity of employment laws in that state. 2019-2024 Growth shows the actual percentage change in nonfarm payroll employment from 2019 to 2024, sourced from U.S. Bureau of Labor Statistics data.
The map shows a pattern that closely tracks what employers already know intuitively. New York scores 87.3, the highest in the country, followed closely by California at 83.9. After those two, there is a notable drop-off to Massachusetts (57.8), Illinois (52.5), and New Jersey (48.7). The rest of the top ten are all states that appeared repeatedly in the survey's difficulty rankings: Pennsylvania, Washington, Oregon, Colorado, and Connecticut.
At the other end of the scale, Idaho, Utah, Florida, and Texas score below 5. These are states where employers report minimal compliance friction and where employment growth since COVID has been among the strongest in the country. The relationship between those two facts is not coincidental.
One thing the map makes clear is that complexity is not evenly distributed. A handful of states carry a disproportionate share of the regulatory weight. The dark purple cluster in the Northeast and along the Pacific Coast is not just where rules are more numerous; it is where the cost and risk of hiring have become significant enough to change employer behavior.
Complete 50-State Employment Index (2019 to 2024)
The table below presents the full picture: nonfarm employment for all 50 states and the District of Columbia across every year since COVID, including net change, percentage growth, and the COVID employment drop in 2020. High-regulation states are highlighted.
Is Regulation the Cause?
The honest answer is that it is a contributing factor, and a significant one. But it is not the only variable.
Sun Belt migration, housing affordability, industry composition, and cost of living all influence where employers choose to hire and where workers choose to live. States like Idaho and Utah benefit from geographic and demographic tailwinds that go beyond regulatory policy alone.
But here is what makes the compliance argument unusually strong: employers are telling us directly that it changes their hiring behavior.
FoxHire's 2026 Multi-State Hiring Compliance Burden Index, a survey of over 500 HR professionals, recruiters, and compliance leaders, found that 48% of employers have delayed or declined to hire in a state because of compliance uncertainty, 50% have turned down a candidate specifically because of the compliance complexity tied to their state of residence, 36% identify California as the single most difficult state to stay compliant in, and 33% identify New York as their second most difficult state.
Those are not hypothetical risks, but rather are real hiring decisions that did not happen. Jobs that workers in those states did not get, because the regulatory environment made the hire feel too risky, too expensive, or too complicated.
Layer that on top of the BLS employment data and a clear picture emerges: the states employers find hardest to navigate are the same states where job growth has lagged. Whether regulation is the primary driver or a compounding factor, the outcome for workers is the same.
What the Data Means for Employers
If you are expanding your workforce and deciding where to hire, the regulatory environment is not just a legal checkbox. It is a strategic variable. High-compliance states require more infrastructure, more legal exposure, and more time to onboard. For many employers, that translates into fewer hires in those states.
That does not mean you should avoid hiring in California, New York, or Illinois. The talent is there. The business opportunities are real. But doing it right requires either significant internal compliance resources or a trusted partner who handles it for you.
An Employer of Record like FoxHire exists precisely to remove that friction. By handling payroll, benefits, taxes, onboarding, and compliance across all 50 states, we make it possible to hire in the most complex states with the same speed and confidence as hiring in the simplest ones.
The compliance burden is real. The employment impact is real. But it does not have to stop you from hiring where the talent is.
Data source: U.S. Bureau of Labor Statistics, State and Metro Area Employment, Hours, and Earnings (SAE), Annual Averages 2019 to 2024, FoxHire's own survey.
Transform Your Hiring Process Today
Experience seamless hiring with our platform. Get started with a demo or sign up now!

FAQs
Find answers to common questions about our services and the contingent workforce management.
FoxHire is an Employer of Record service that simplifies hiring for contingent workforce managers. We handle payroll, compliance, and onboarding, allowing you to focus on your core business. Our tech-forward platform automates administrative tasks, making workforce management efficient.
Our platform streamlines the hiring process by managing all administrative tasks related to contingent workers. You can easily onboard new hires and ensure compliance with regulations. This allows staffing agencies and HR departments to scale talent effectively.
Healthcare, education, and professional services sectors can greatly benefit from our services. We cater to organizations looking to manage a flexible workforce efficiently. Our solutions are designed to reduce administrative burdens and compliance risks.
Yes, we offer a demo of our platform to showcase its features and benefits. This allows potential users to see how FoxHire can streamline their hiring processes. Schedule your demo today to explore our solutions.
Signing up is easy! Simply visit our website and click on the 'Sign Up' button. Follow the prompts to create your account and start managing your contingent workforce.
Still have questions?
We're here to help you with any inquiries.